Before moving to the Bay Area, I earned my social psychology PhD from NYU. During my short-lived career as an academic psychologist, I was interested in how people pursued their goals, as well as what made them happy. Prior to that, I studied marine engineering at Singapore Polytechnic, but soon realized I didn't want to spend months at sea (because of the monsters).
My favorite thing about working at Owler is collaborating with engineers and designers who are more talented than I am to provide our members with world-class business intelligence. I work on projects related to onboarding our users, producing insights with our data, and everything else web-related, like SEO.
Besides my substantive knowledge about human behavior, my primary skills lie in research methods and statistics. I also code in Python, and use SQL, MongoDB, Google Analytics and Amplitude on a daily basis. Even though I'm most familiar with Python, my favorite programming language is actually Ruby, because I think it is the cutest.
For example:
	  		#If I want a list of integers: [1,2,3,4,5]

	  		#In Python:

	  		list(range(1,6))  #cuteness rating = 0/10

	  		#In Ruby:

	  		(1..5).to_a #cuteness rating = 10/10
In my free time, I enjoy attending hackathons and networking events, eating broccoli and strawberry ice cream, playing the guitar, and swimming. My goal in life is add to my list of projects that I think are really cool, but to which everyone else will ask: "That sounds like a terrible idea, why did you do that?"
When I first joined OpenUp as its product manager, we acquired user data by offering users $10 or $20 gift cards to share their data for a month or two using a Chrome browser extension. This ate into our margin, and we had to work with publishers to recruit users, which took time and resources to coordinate.
The extension itself did not do much:
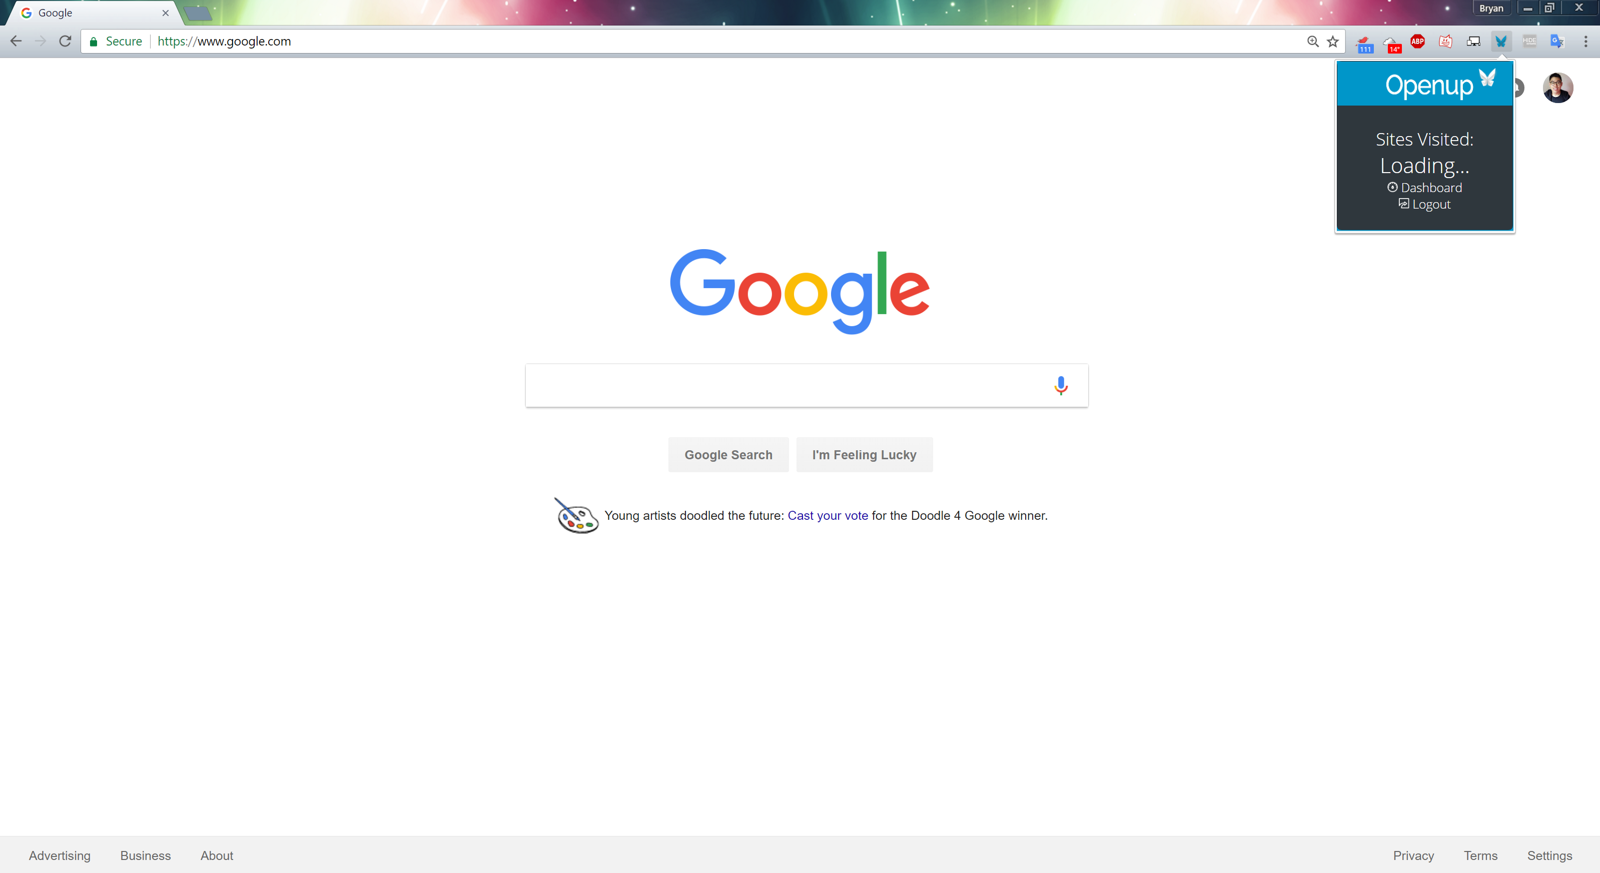
My goal was to have the extension itself provide value to users, which would do two things:
Based on preliminary market research, we brainstormed two possible ideas. The first was a version of the quantified self: For example, allowing users to see how often they accessed political content relative to others. The second was a system which helped users to shop:
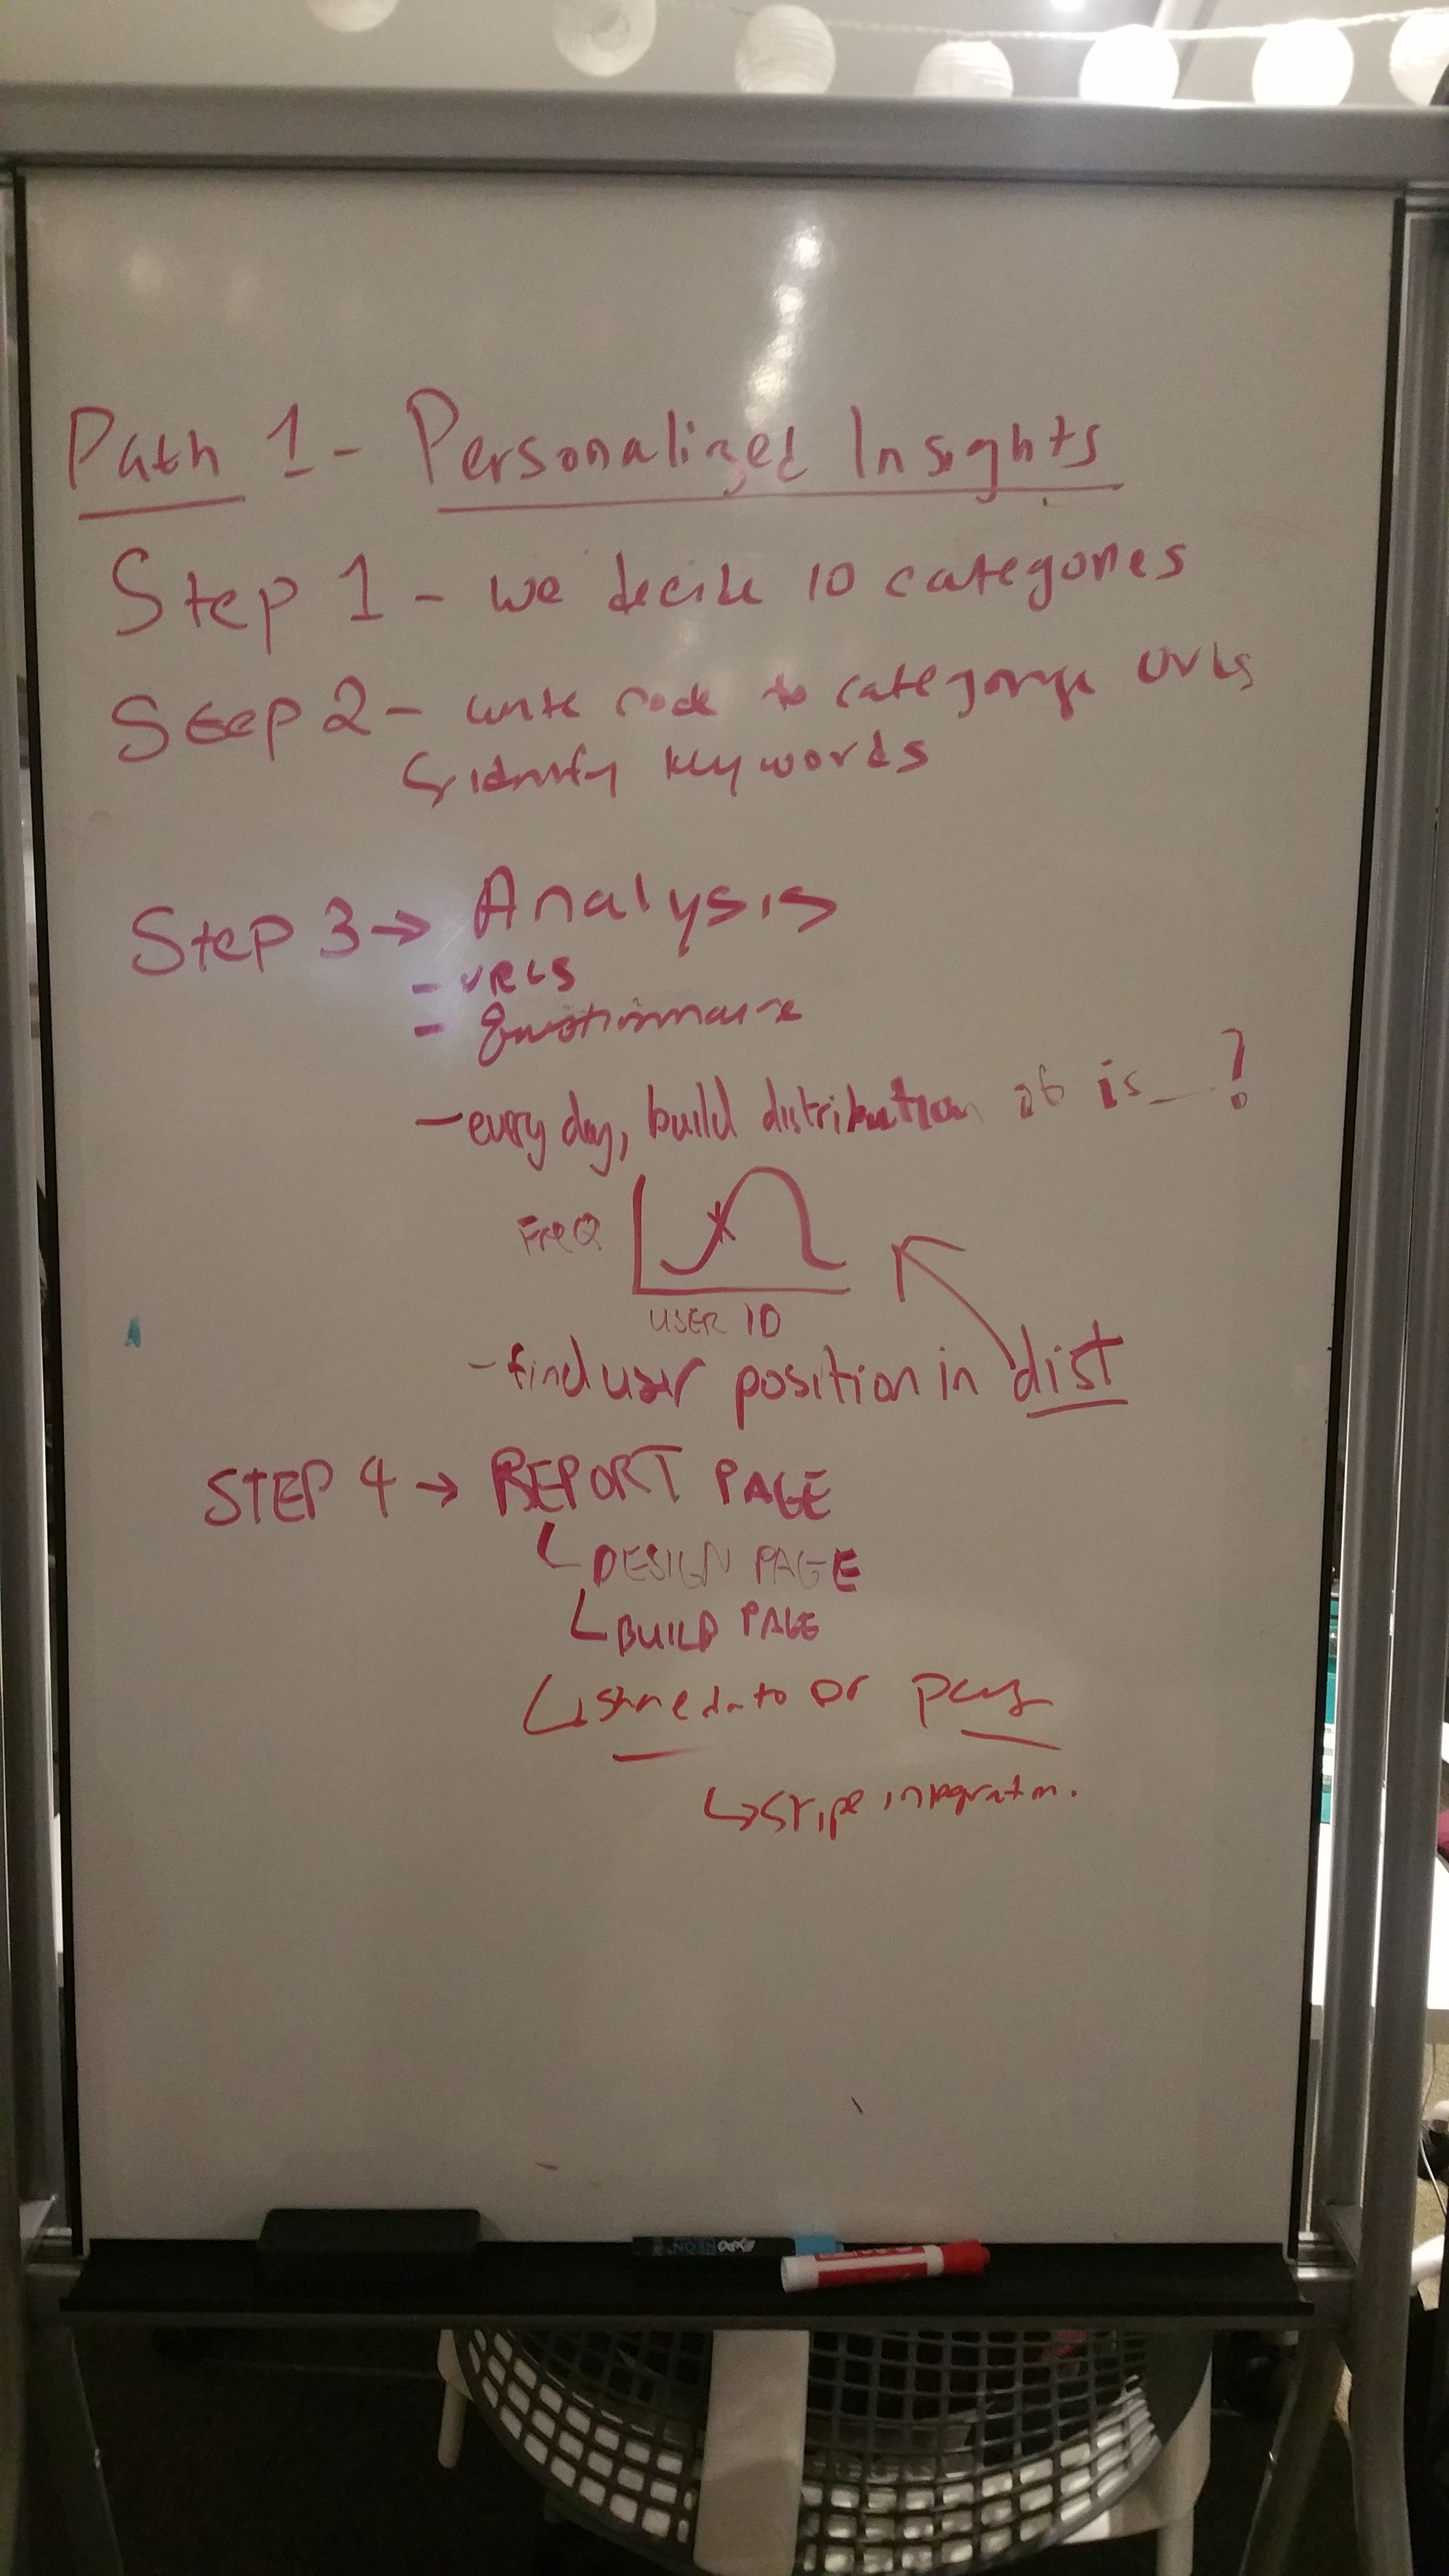

We decided to first pursue the second option, which we called "OpenUp Offers", because it had the benefit of being a tested business model (c.f. the browser extension Honey), and was also simpler to build.
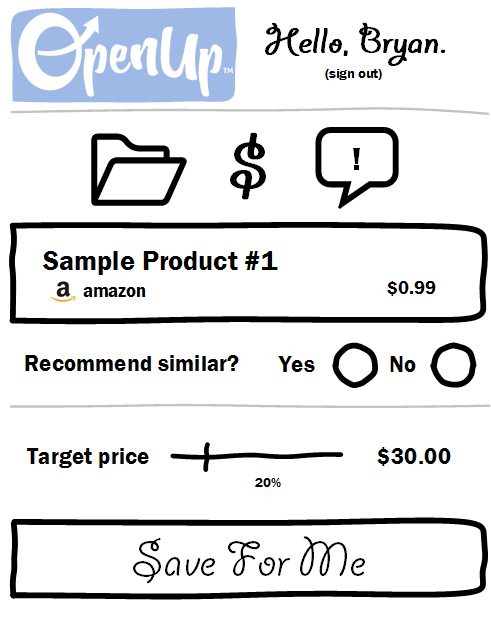
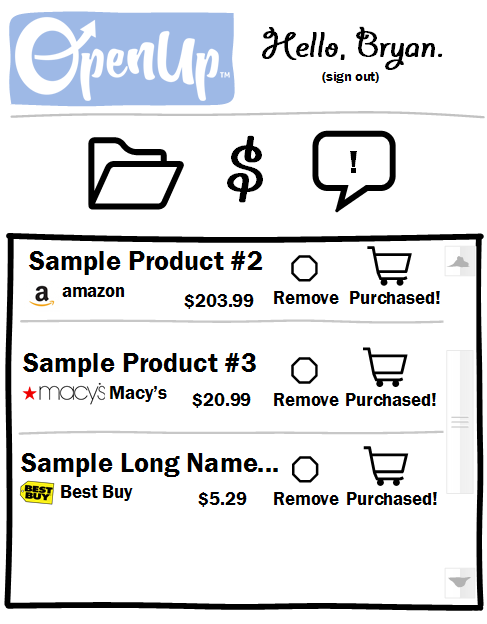
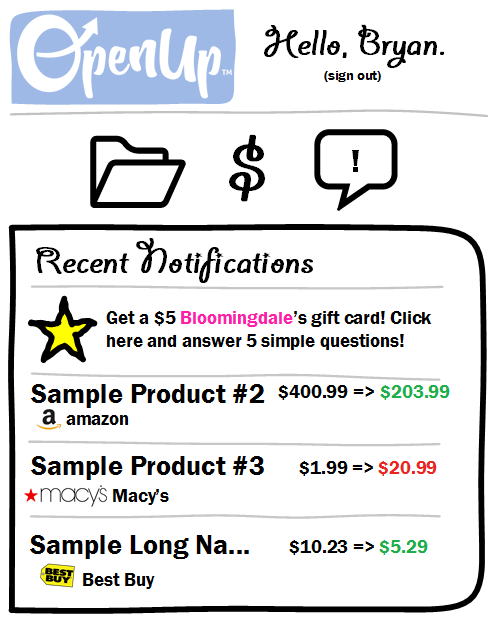
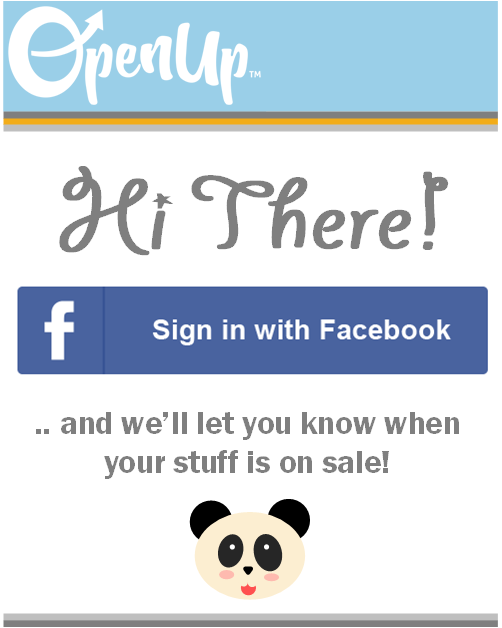
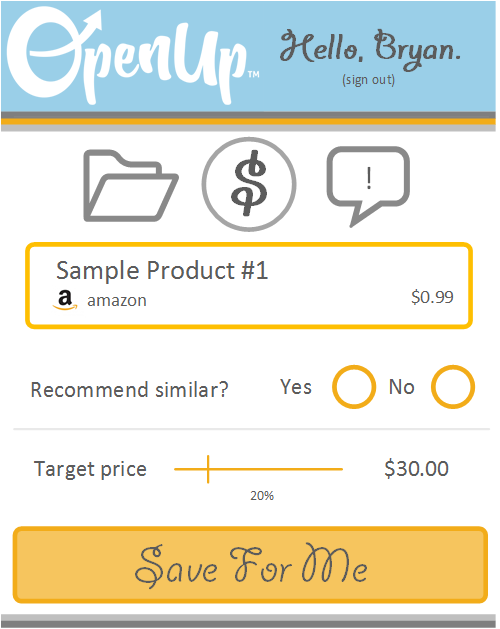
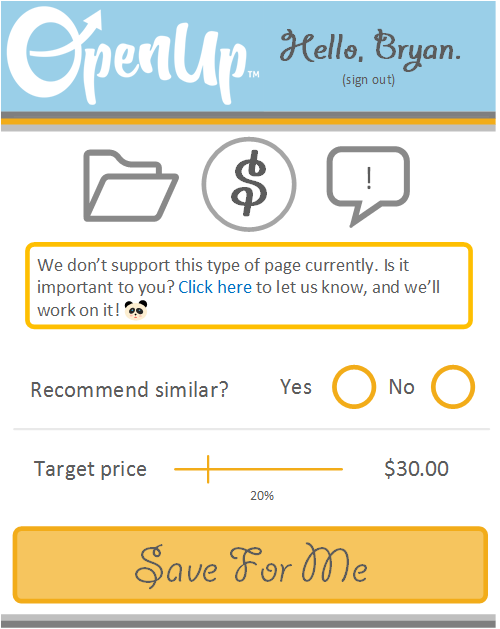
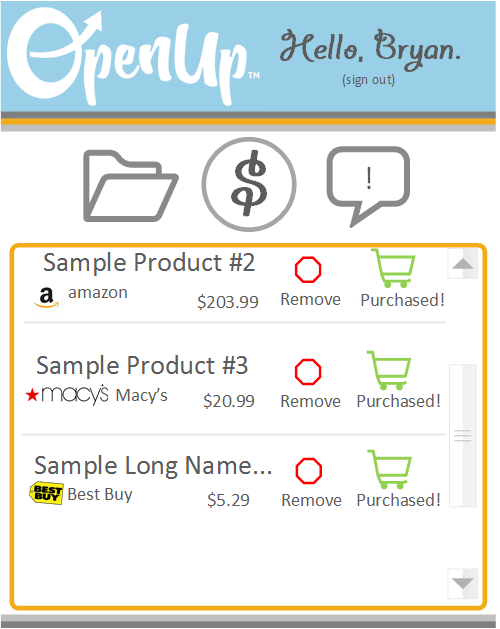
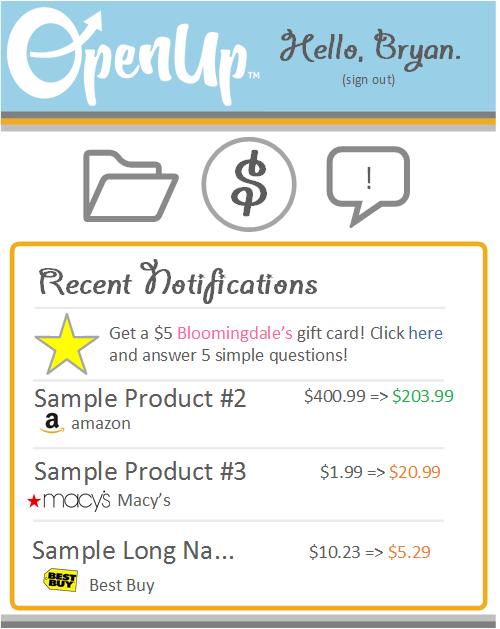
I did some research into existing browser extensions that had similar functionality. From this, I created the following rough mockups:
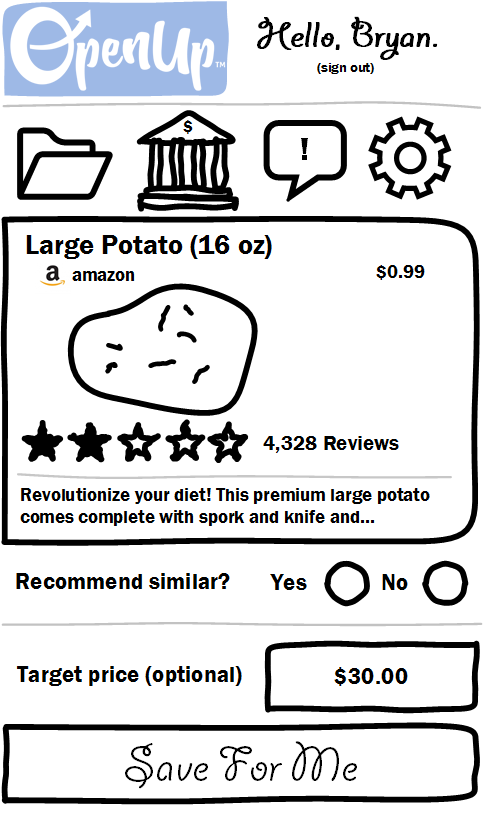
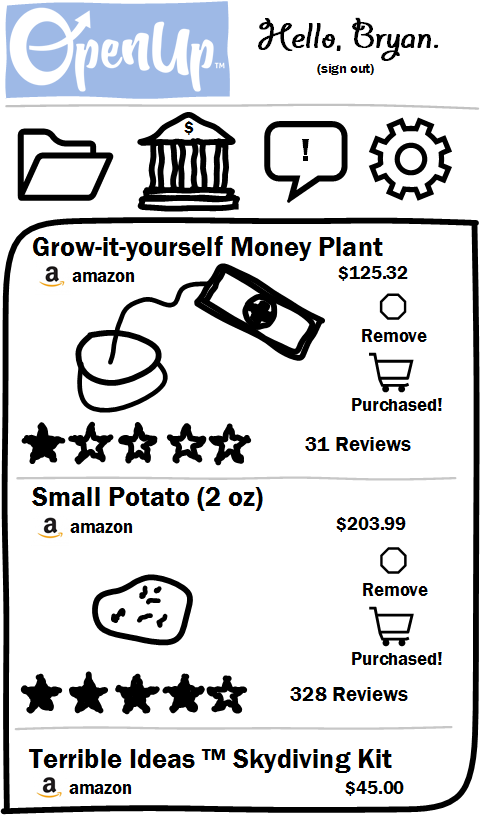
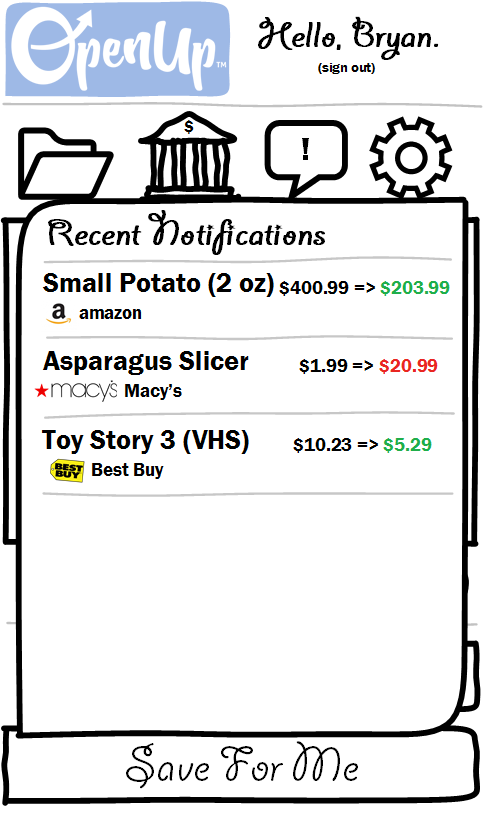
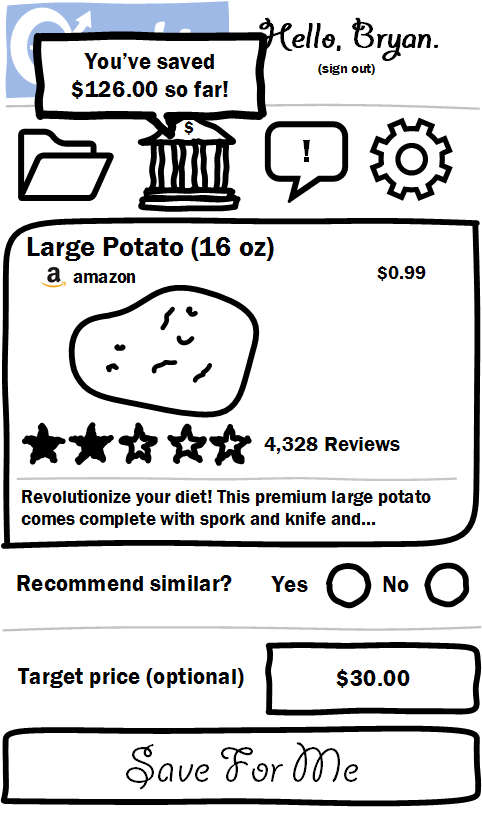
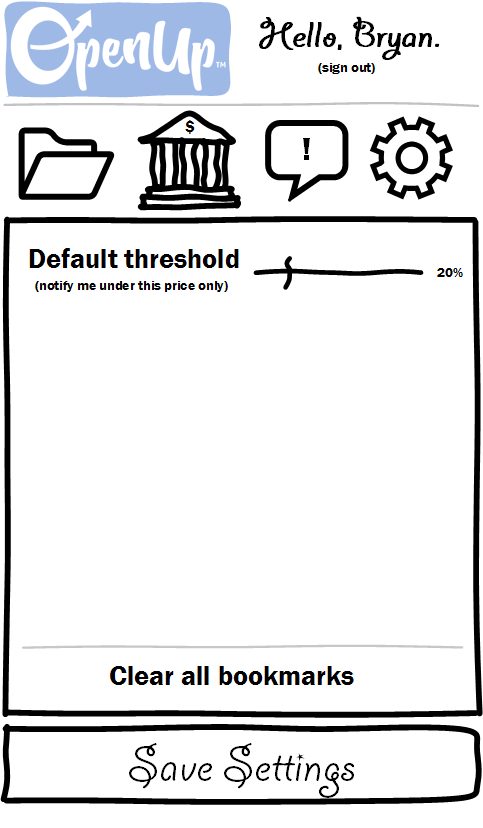
From left to right:
Around this time, I also started writing up a product requirements document. A version of this can be found here.
Initial feedback solicited from informal channels (i.e., friends, family) made it quickly apparent that there was too much going on in the design. This was the second iteration of mockups:
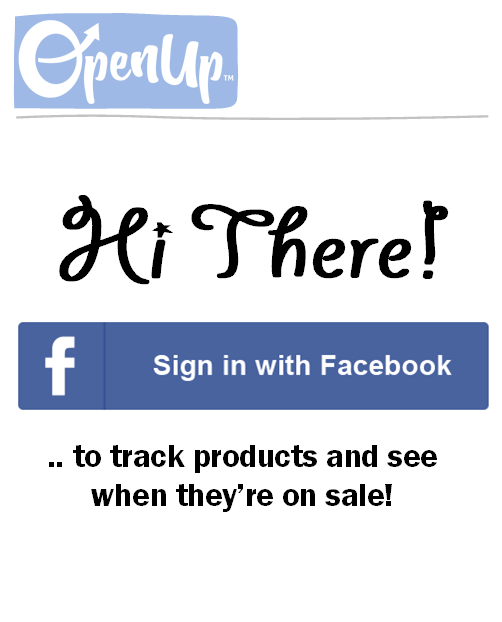
And the third:
At this stage, I recruited a few participants using UserTesting.com to test a clickable prototype using Marvel (see here).
The main objectives of this exercise were to:
In addition to using the product, users were asked questions such as:
Overall, this test suggested that a product designed this way would be pretty user-friendly. Certain features, such as the ability to know how much money a user has saved, were pleasant surprises. A few questions were raised, such as what would be the best way to represent and track pricing information, and notify users, but in general, users were quick to pick up on the functionality and value of the product.
While doing all of this, I was also working with my dev team to spec out the product. For example, I used Visio to illustrate what changes we would need to make to our database:
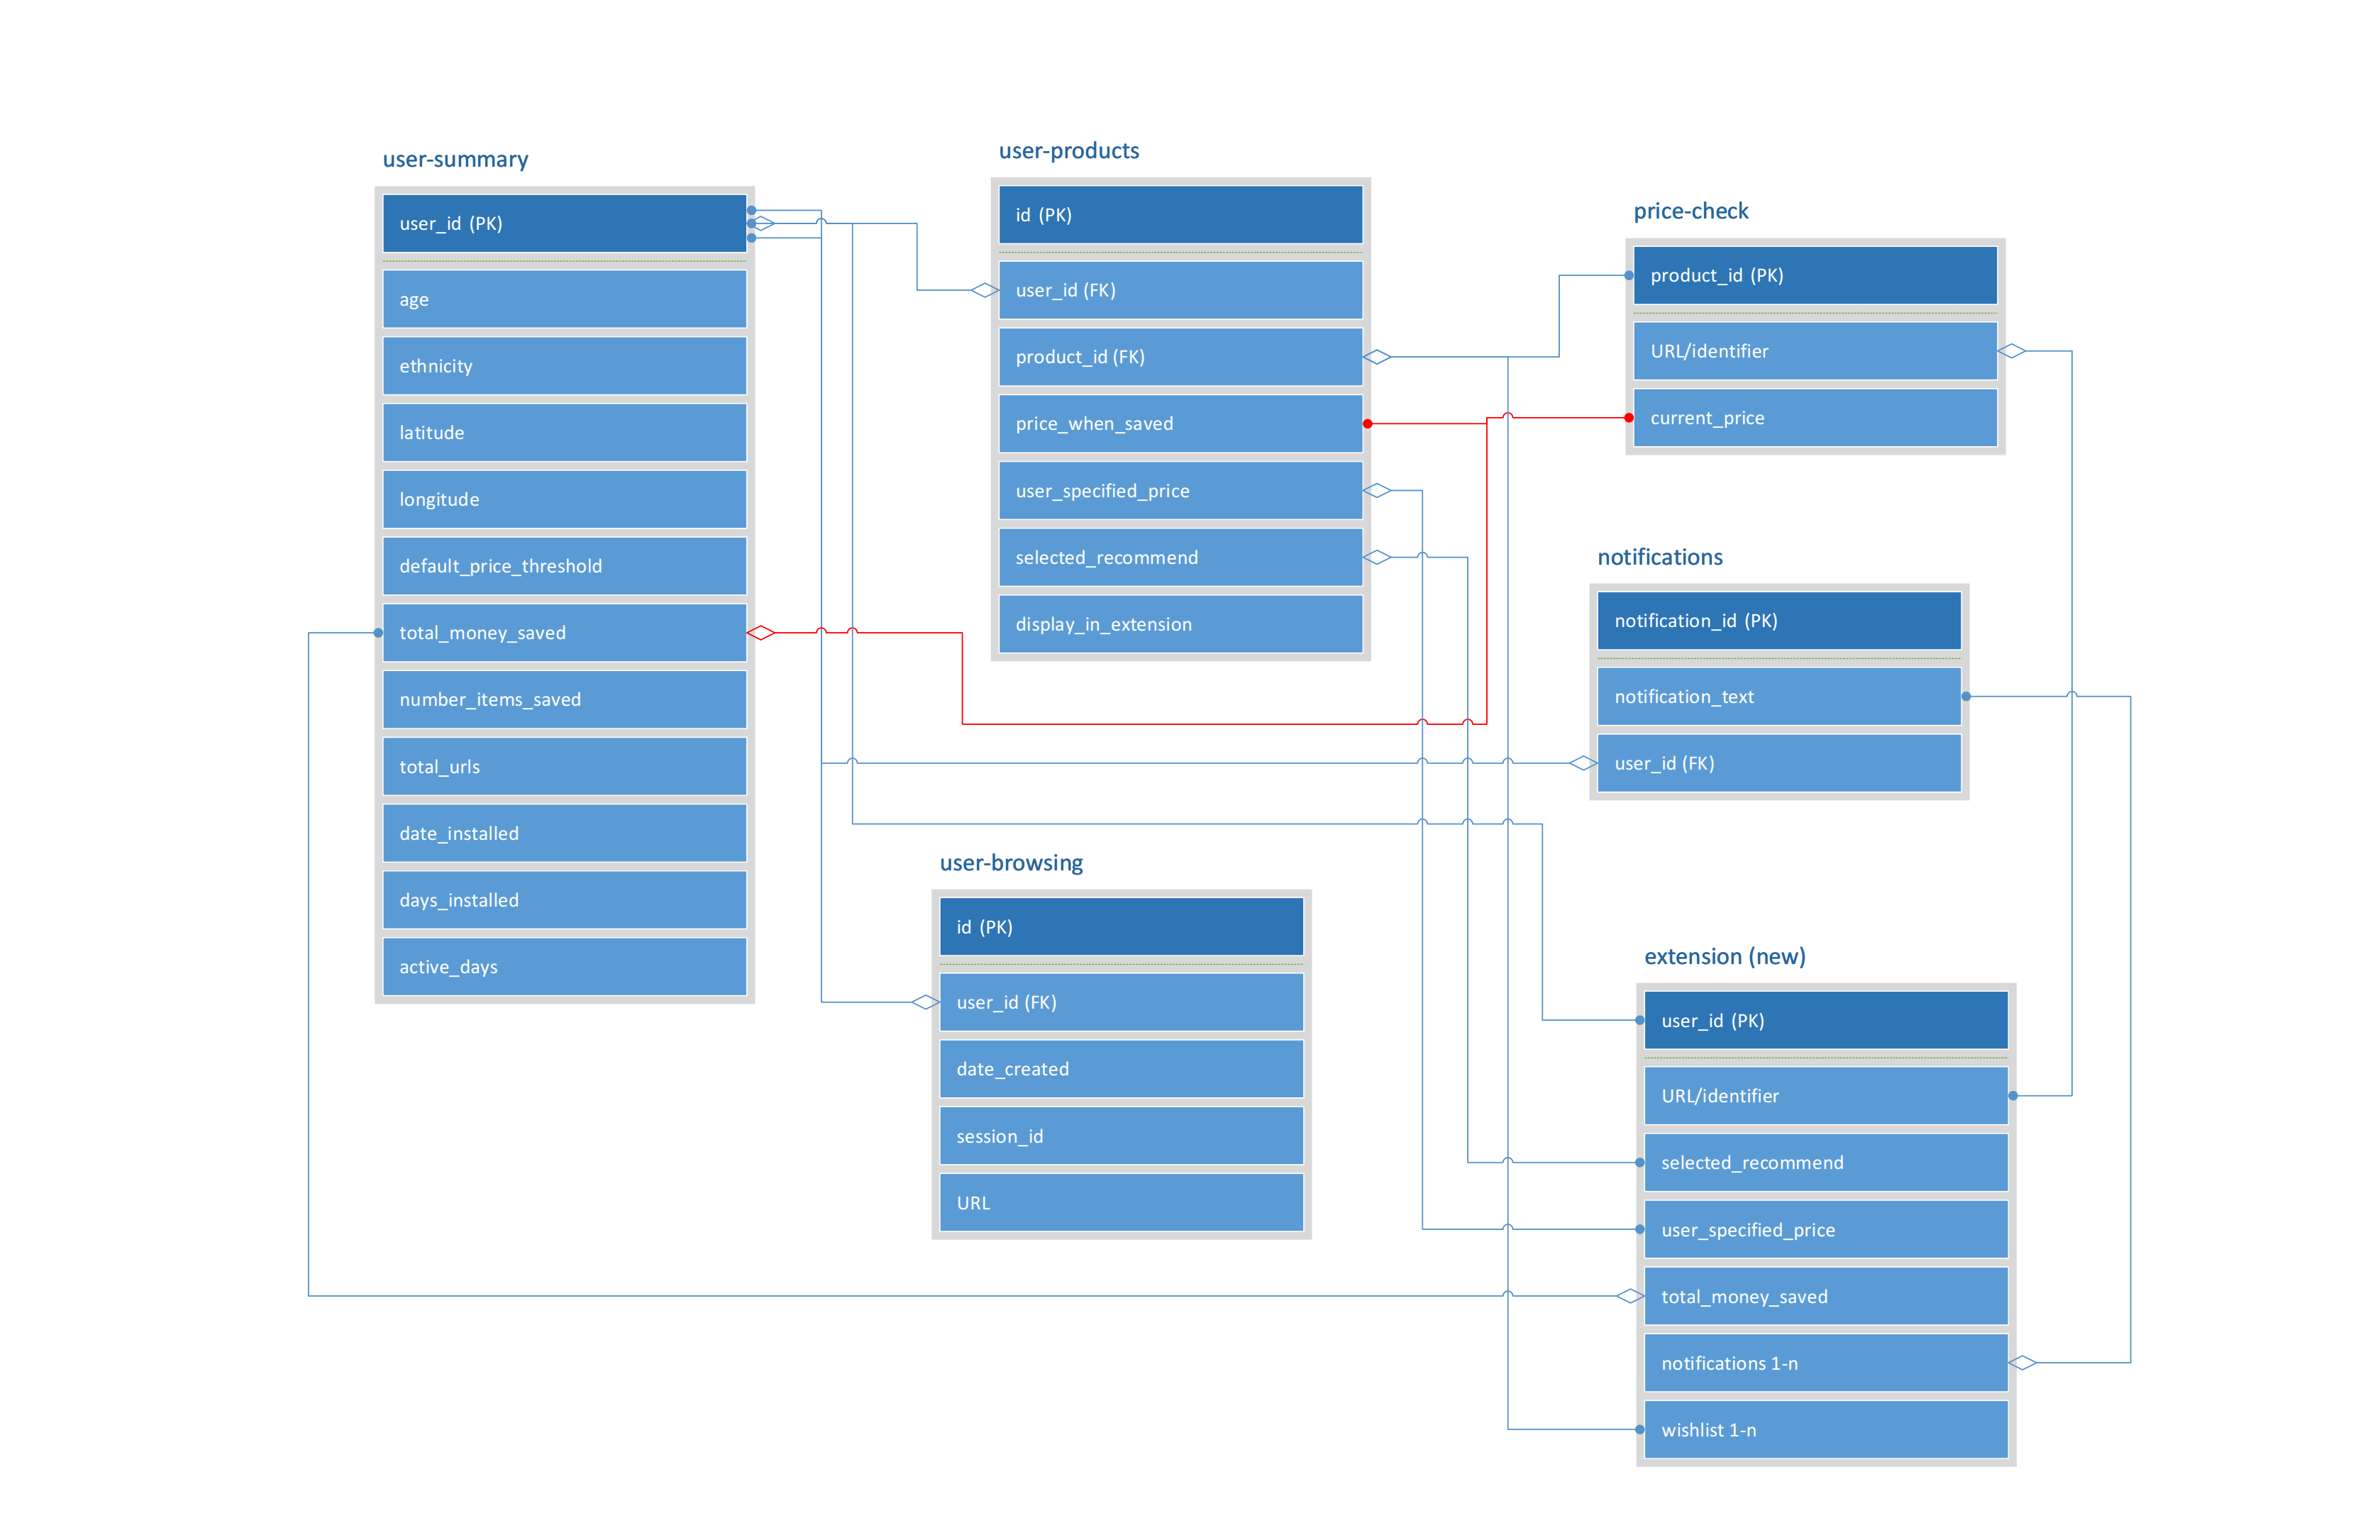
This is an early document that I made for myself to write some of the user stories that we ended up using. We ultimately used Trello to coordinate our sprints.
The extension is currently in beta, and can be downloaded from the Chrome Store here. The current challenges are smoothing out the functionality, and improving the aesthetic of the UI.
CloseSome time ago, I got into an argument with a friend over whether one "eats" or "drinks" soup.
So, I recruited 107 people using Mechanical Turk to answer two questions:
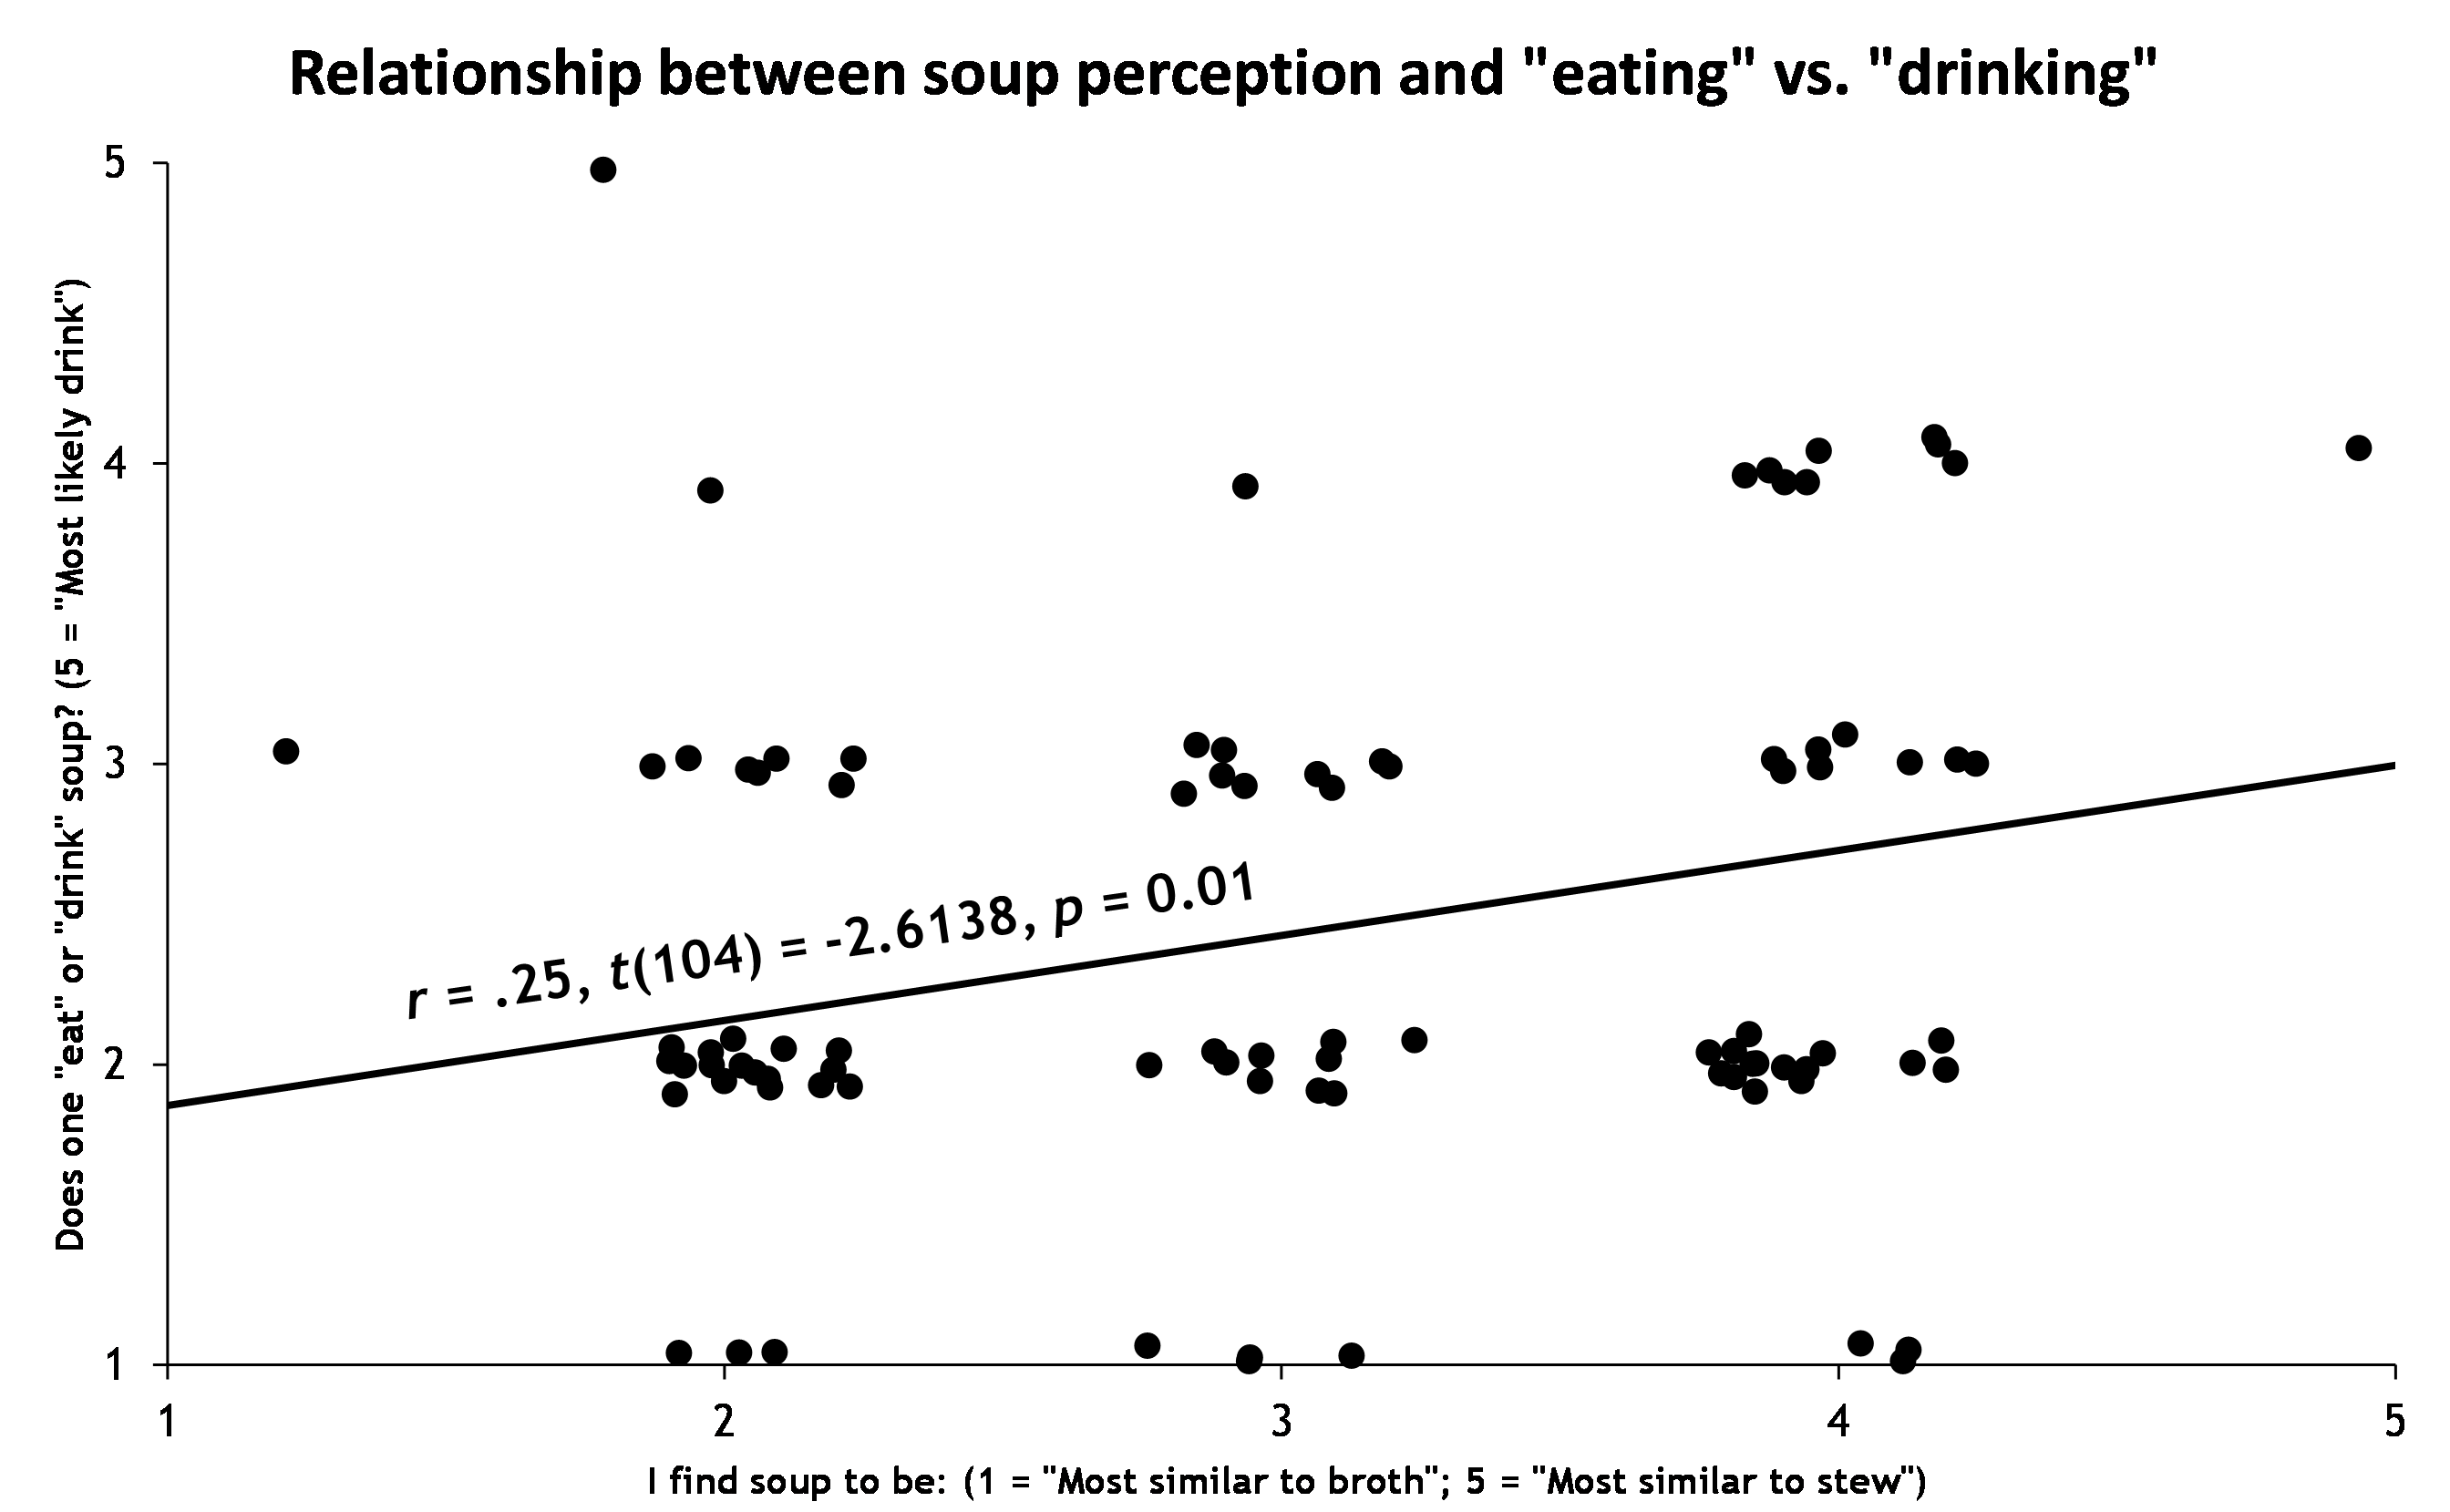
(a) I find soup to be: (1 = "Most similar to broth"; 5 = "Most similar to stew")
(b) Does one "eat" or "drink" soup? (1 = "Most likely eat"; 5 = "Most likely drink")
I hypothesized that people who associate soup with a thick, gooey liquid more similar to stew would be more likely to "eat" soup, while people who associate soup with a clear, liquidy liquid like broth would be more likely to "drink" soup.Supporting my hypothesis, there was a modest (in terms of effect size) but significant correlation between how much one associates soup with broth, and how likely they are to "drink" soup - the more people associate soup with broth, the more likely they would be to say they "drink" it (points are jittered):
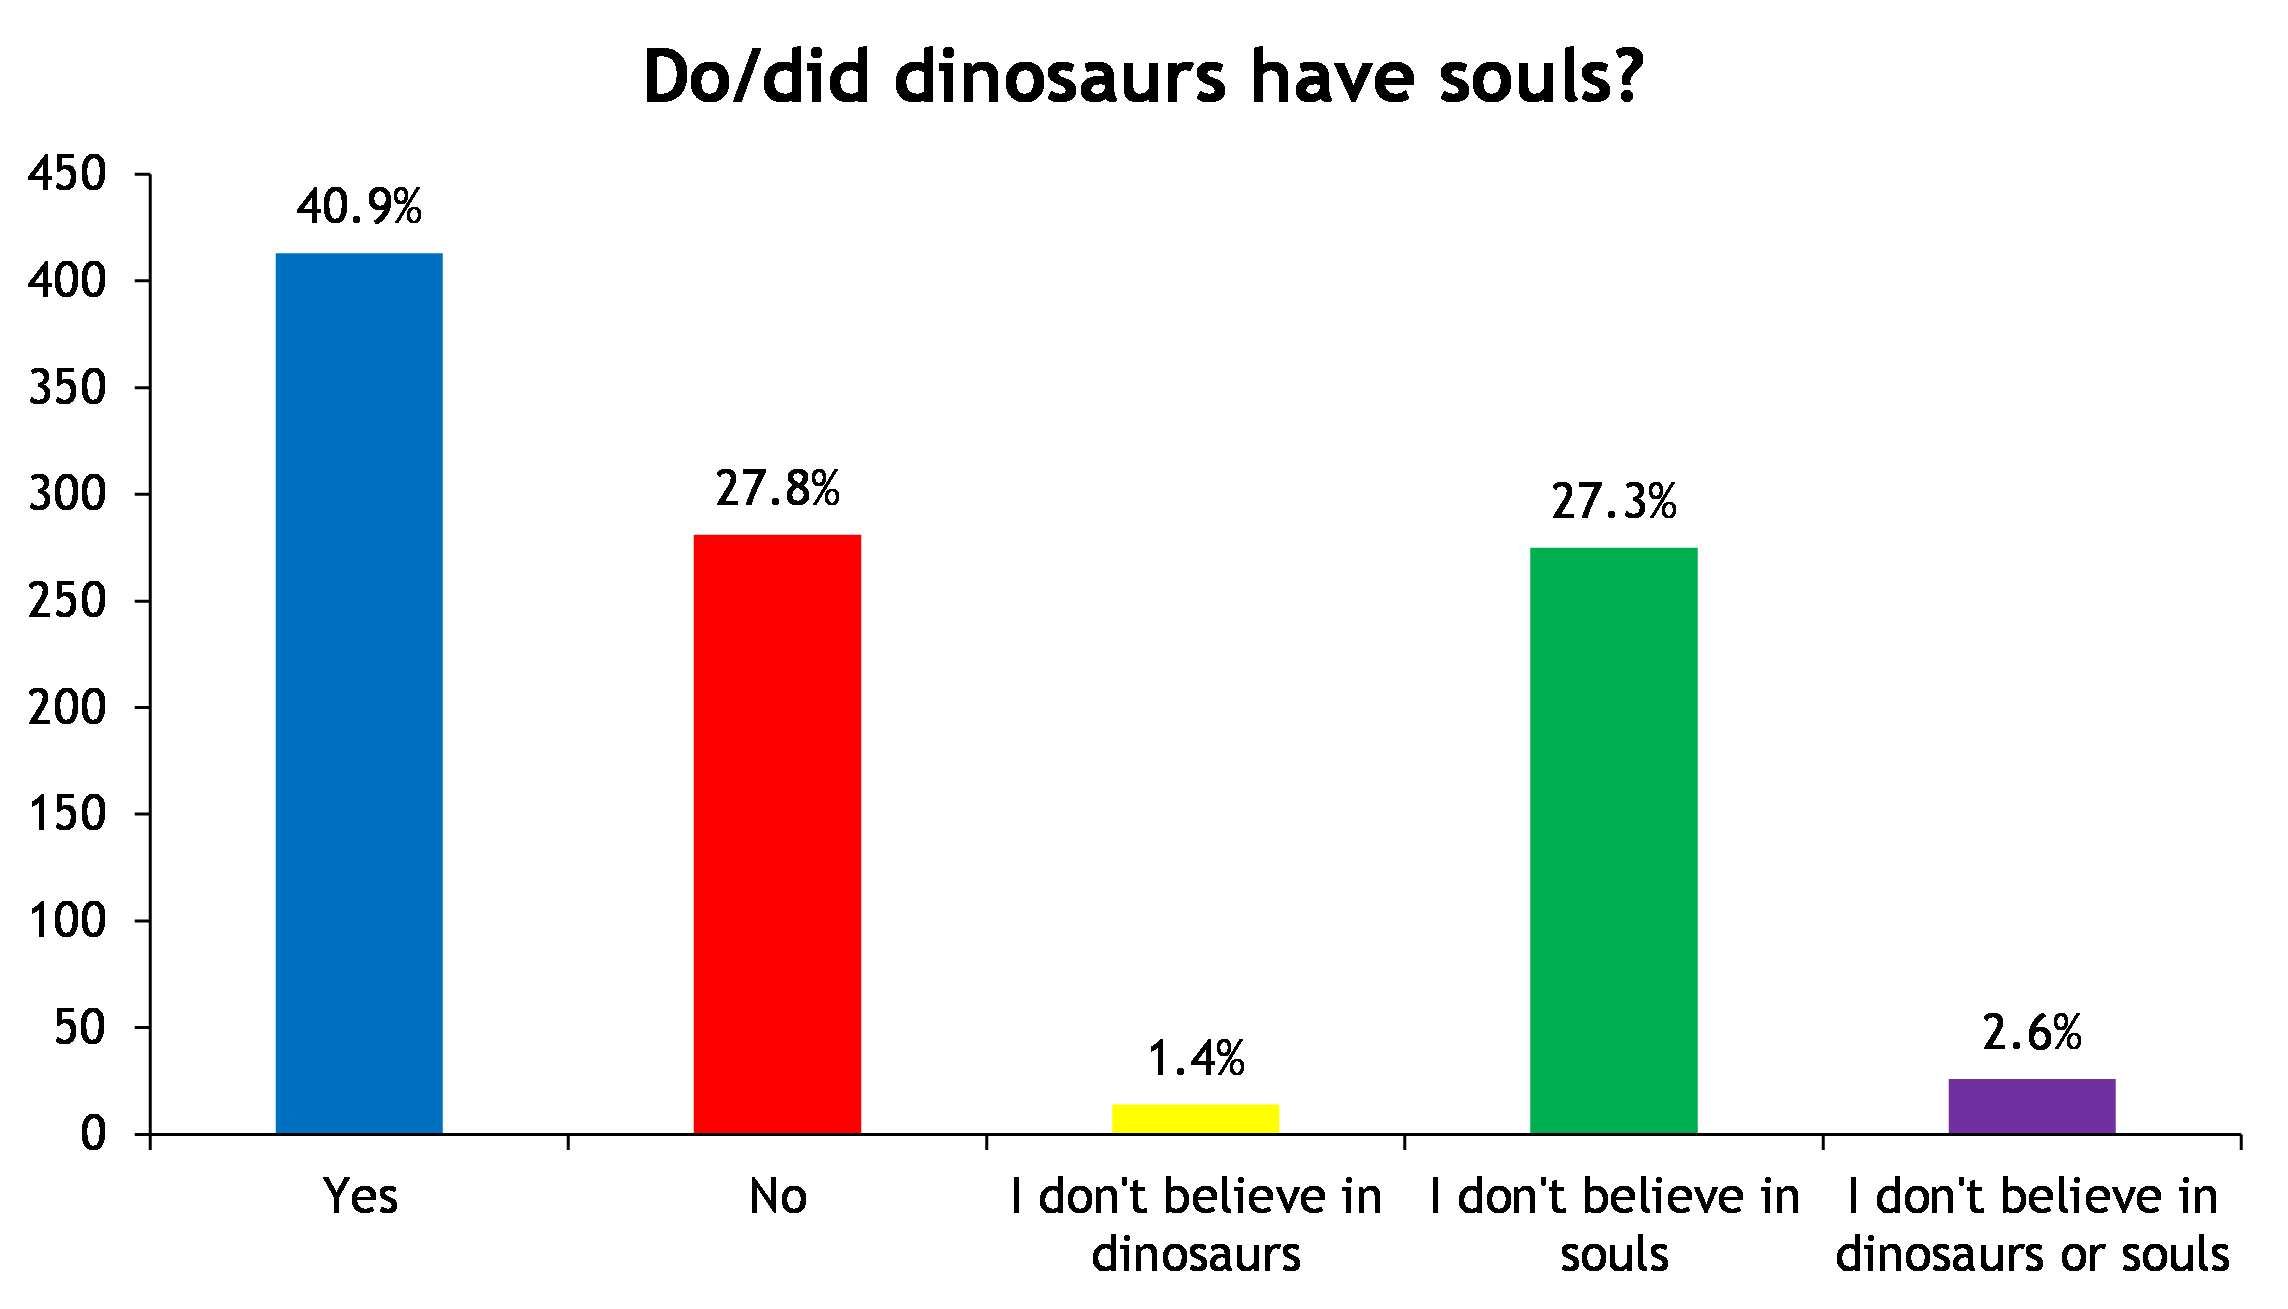
As a kid, I often wondered if dinosaurs had souls, and if so, if they'd still be wandering the earth.
I wanted to find out what the general public (or at least, the MTurk population) thought, so I conducted a poll of 1,000 users. Their response were as follows:
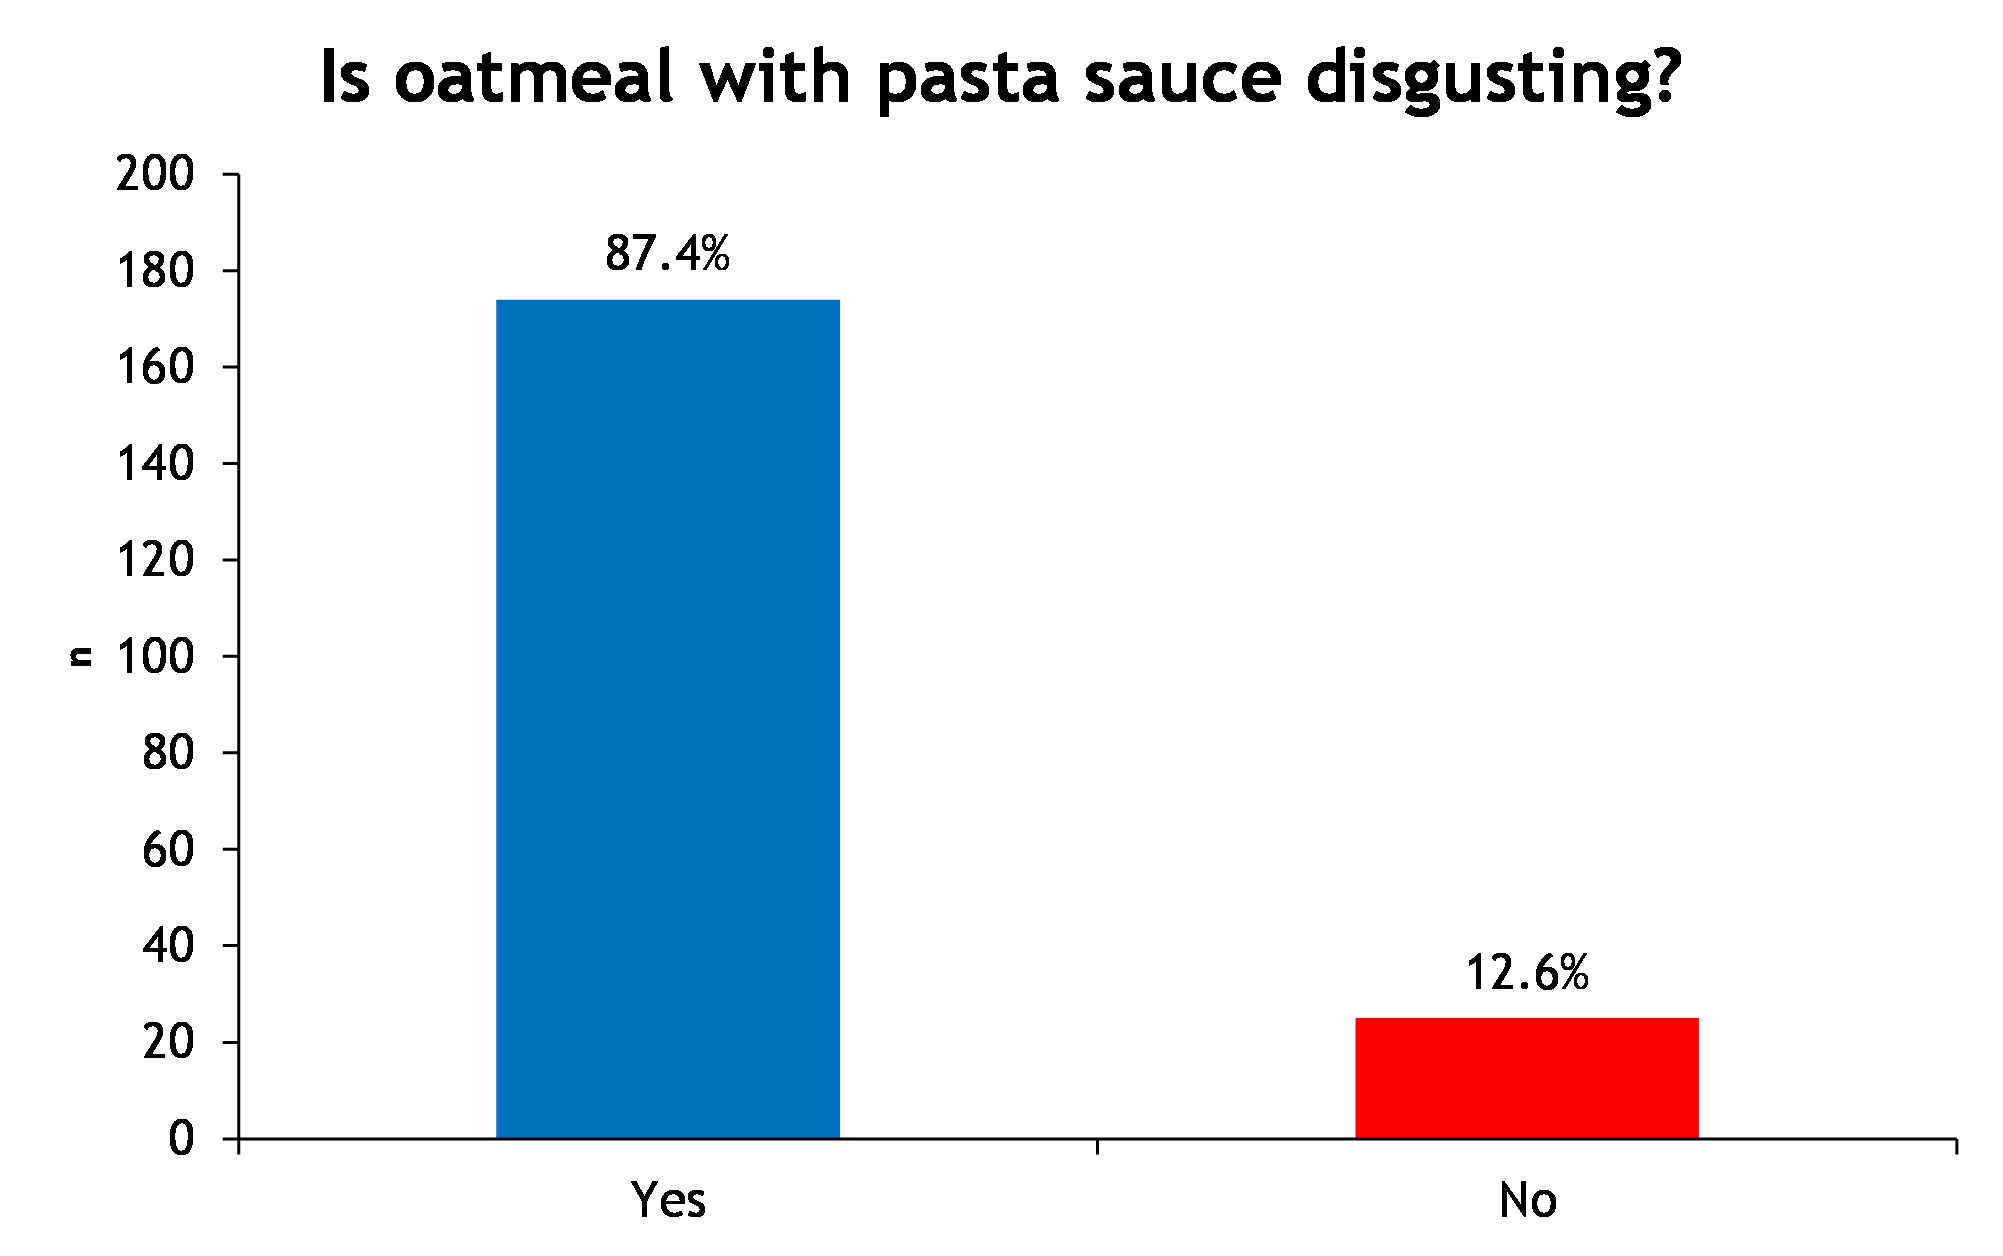
I happen to think oatmeal, when mixed with pasta sauce, tastes like a not-too-unpleasant cross between paella, congee, and rissoto. Everyone else apparently thinks I am out of my mind:
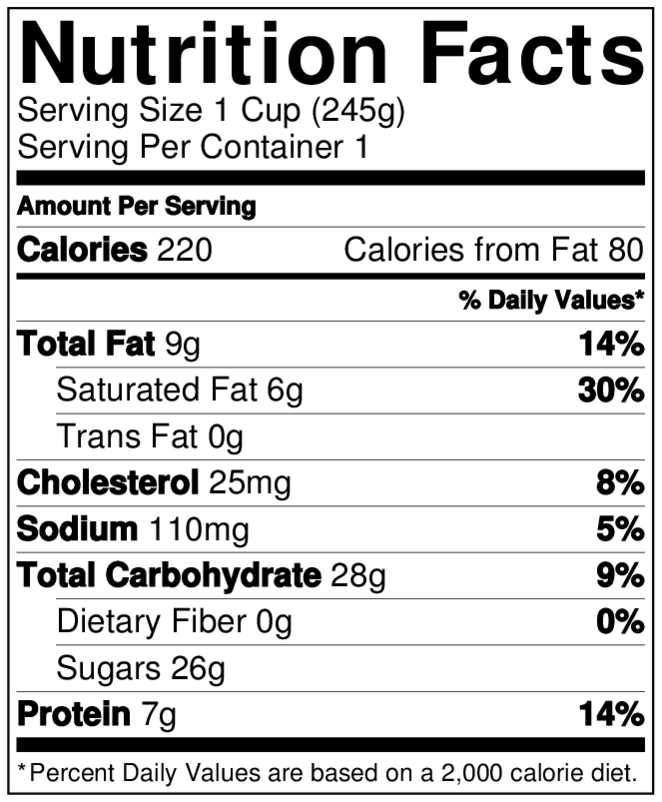
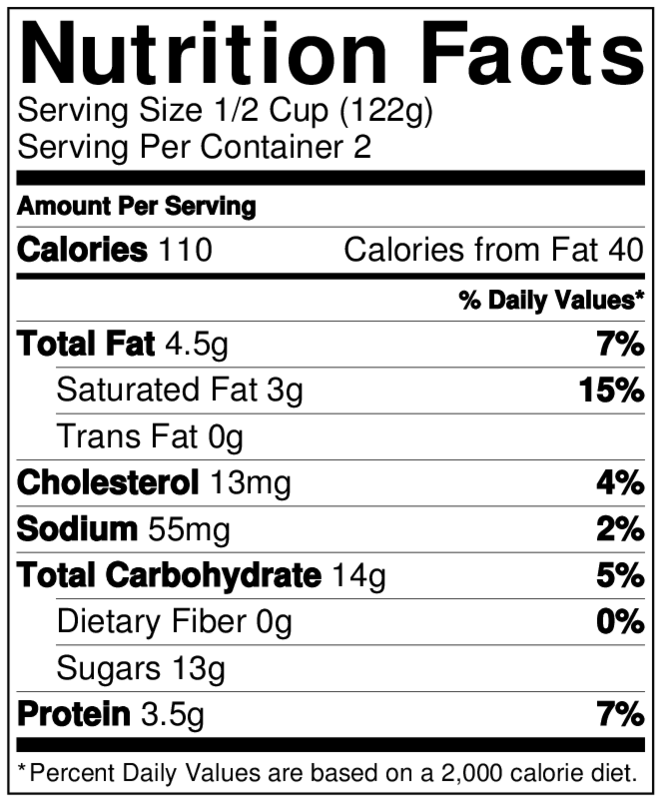
I was teaching my research assistants how to go about designing a simple online experiment. Our cynical assumption was that serving sizes were an attempt to subtly manipulate peoples' perceptions of how healthy food really is.
We recruited 203 people using Amazon's Mechanical Turk, and presented them with two different versions of a nutritional information table of a cup of yogurt. These were identical other than the serving sizes; the serving size of one was half the amount of the other:
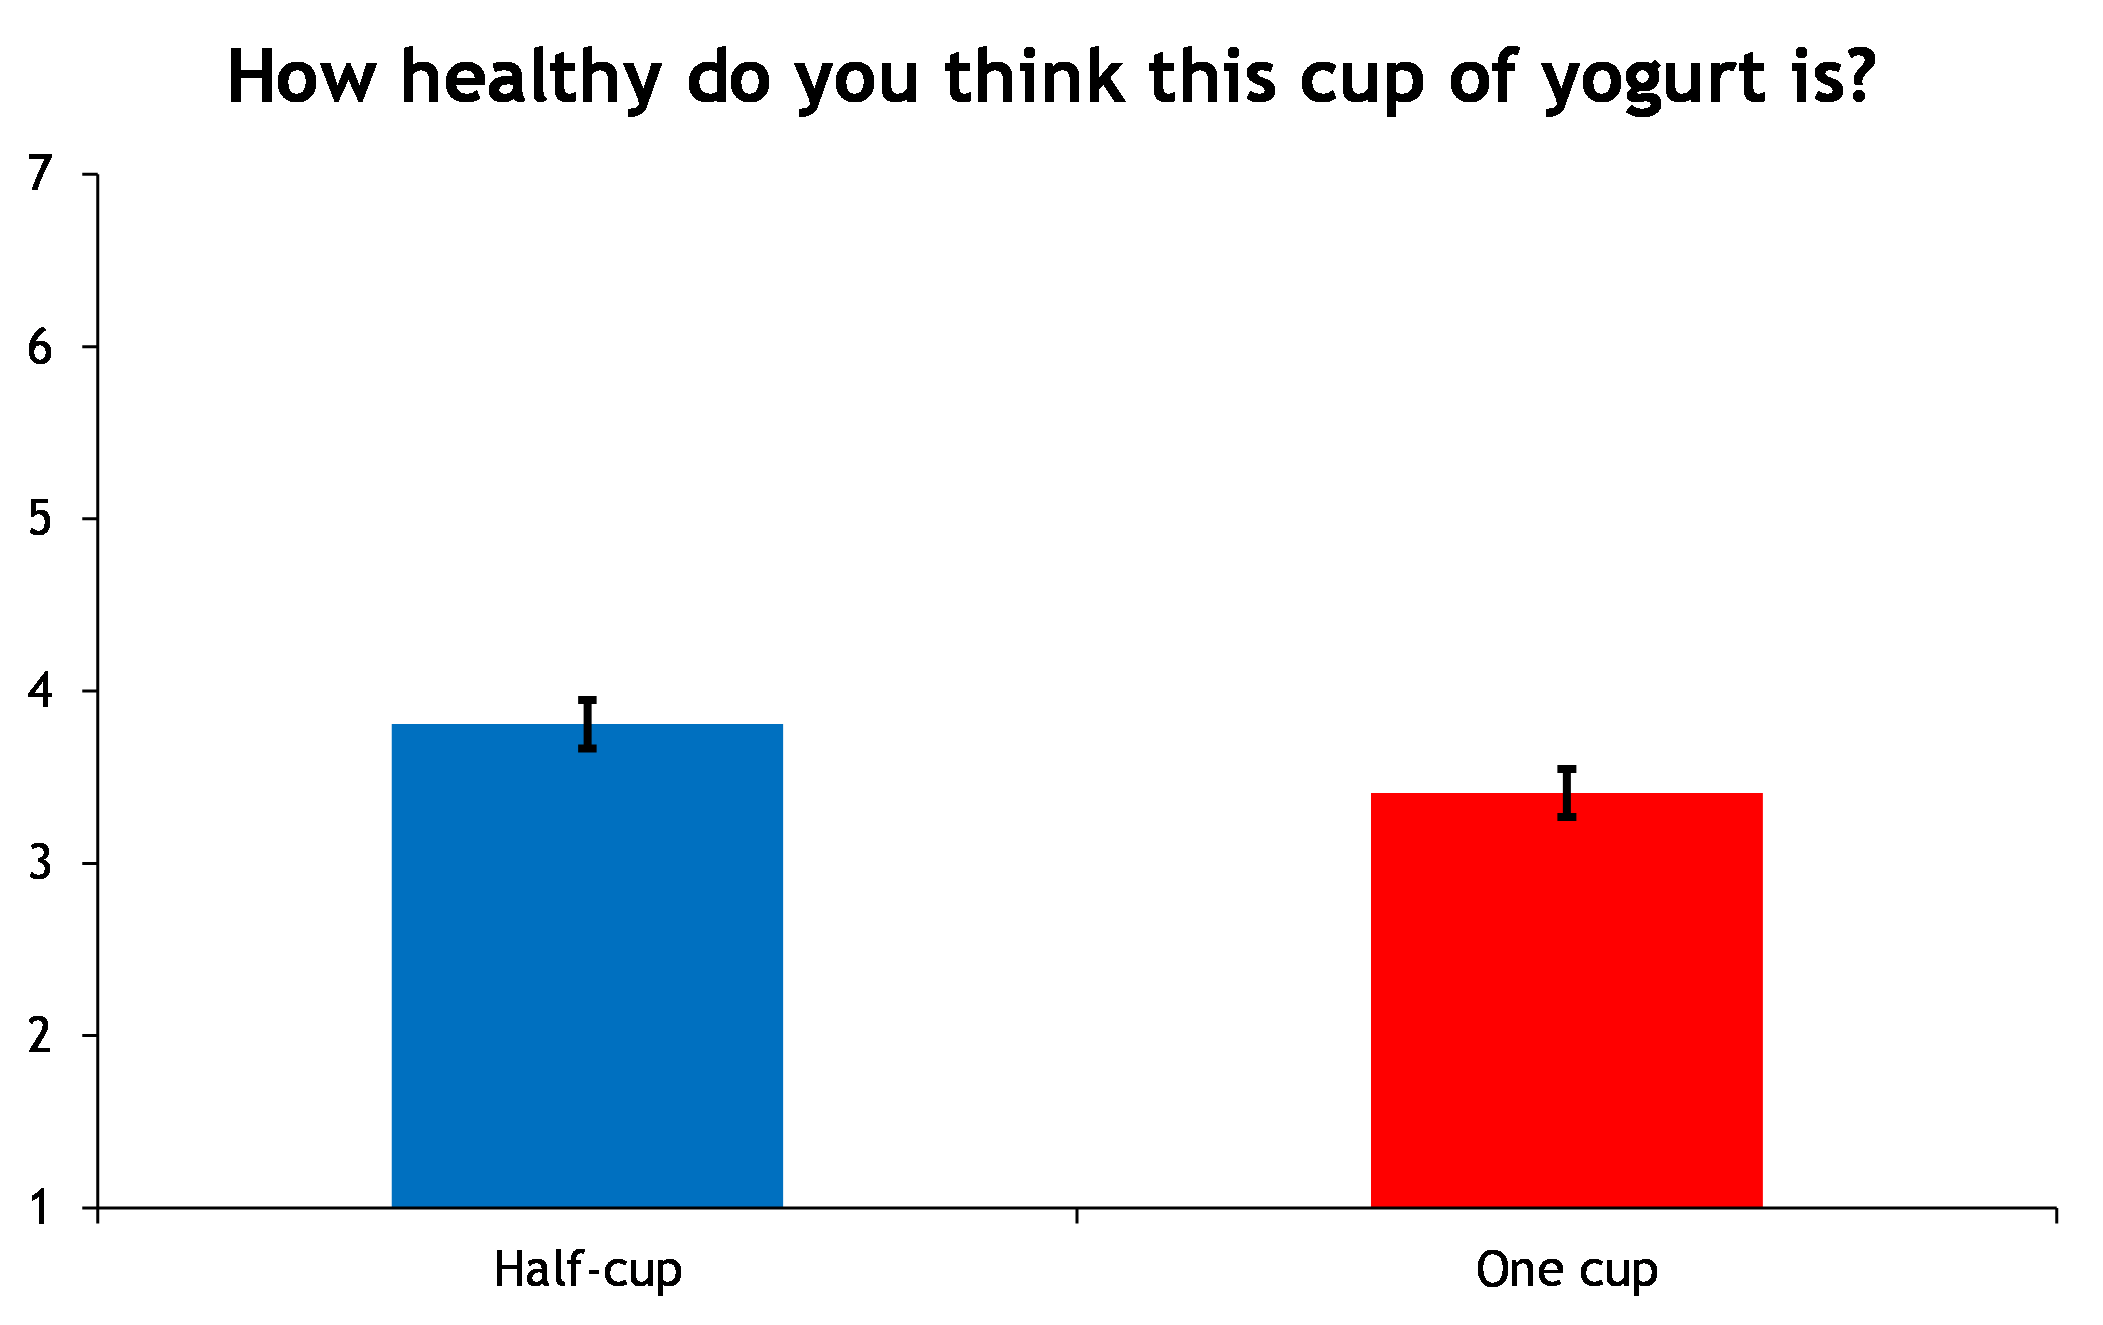
We then asked participants how healthy they thought the cup of yogurt was (on a 7-point scale), and found, using a
t-test, that participants rated the half serving of yogurt (M = 3.81, SD = 1.40) healthier than the whole serving (M= 3.41, SD= 1.35), t(199.92) = 2.07, p = .04:
If I can step outside of my witty, irreverant persona for a second, this is a dataset that I hold really close to my heart.
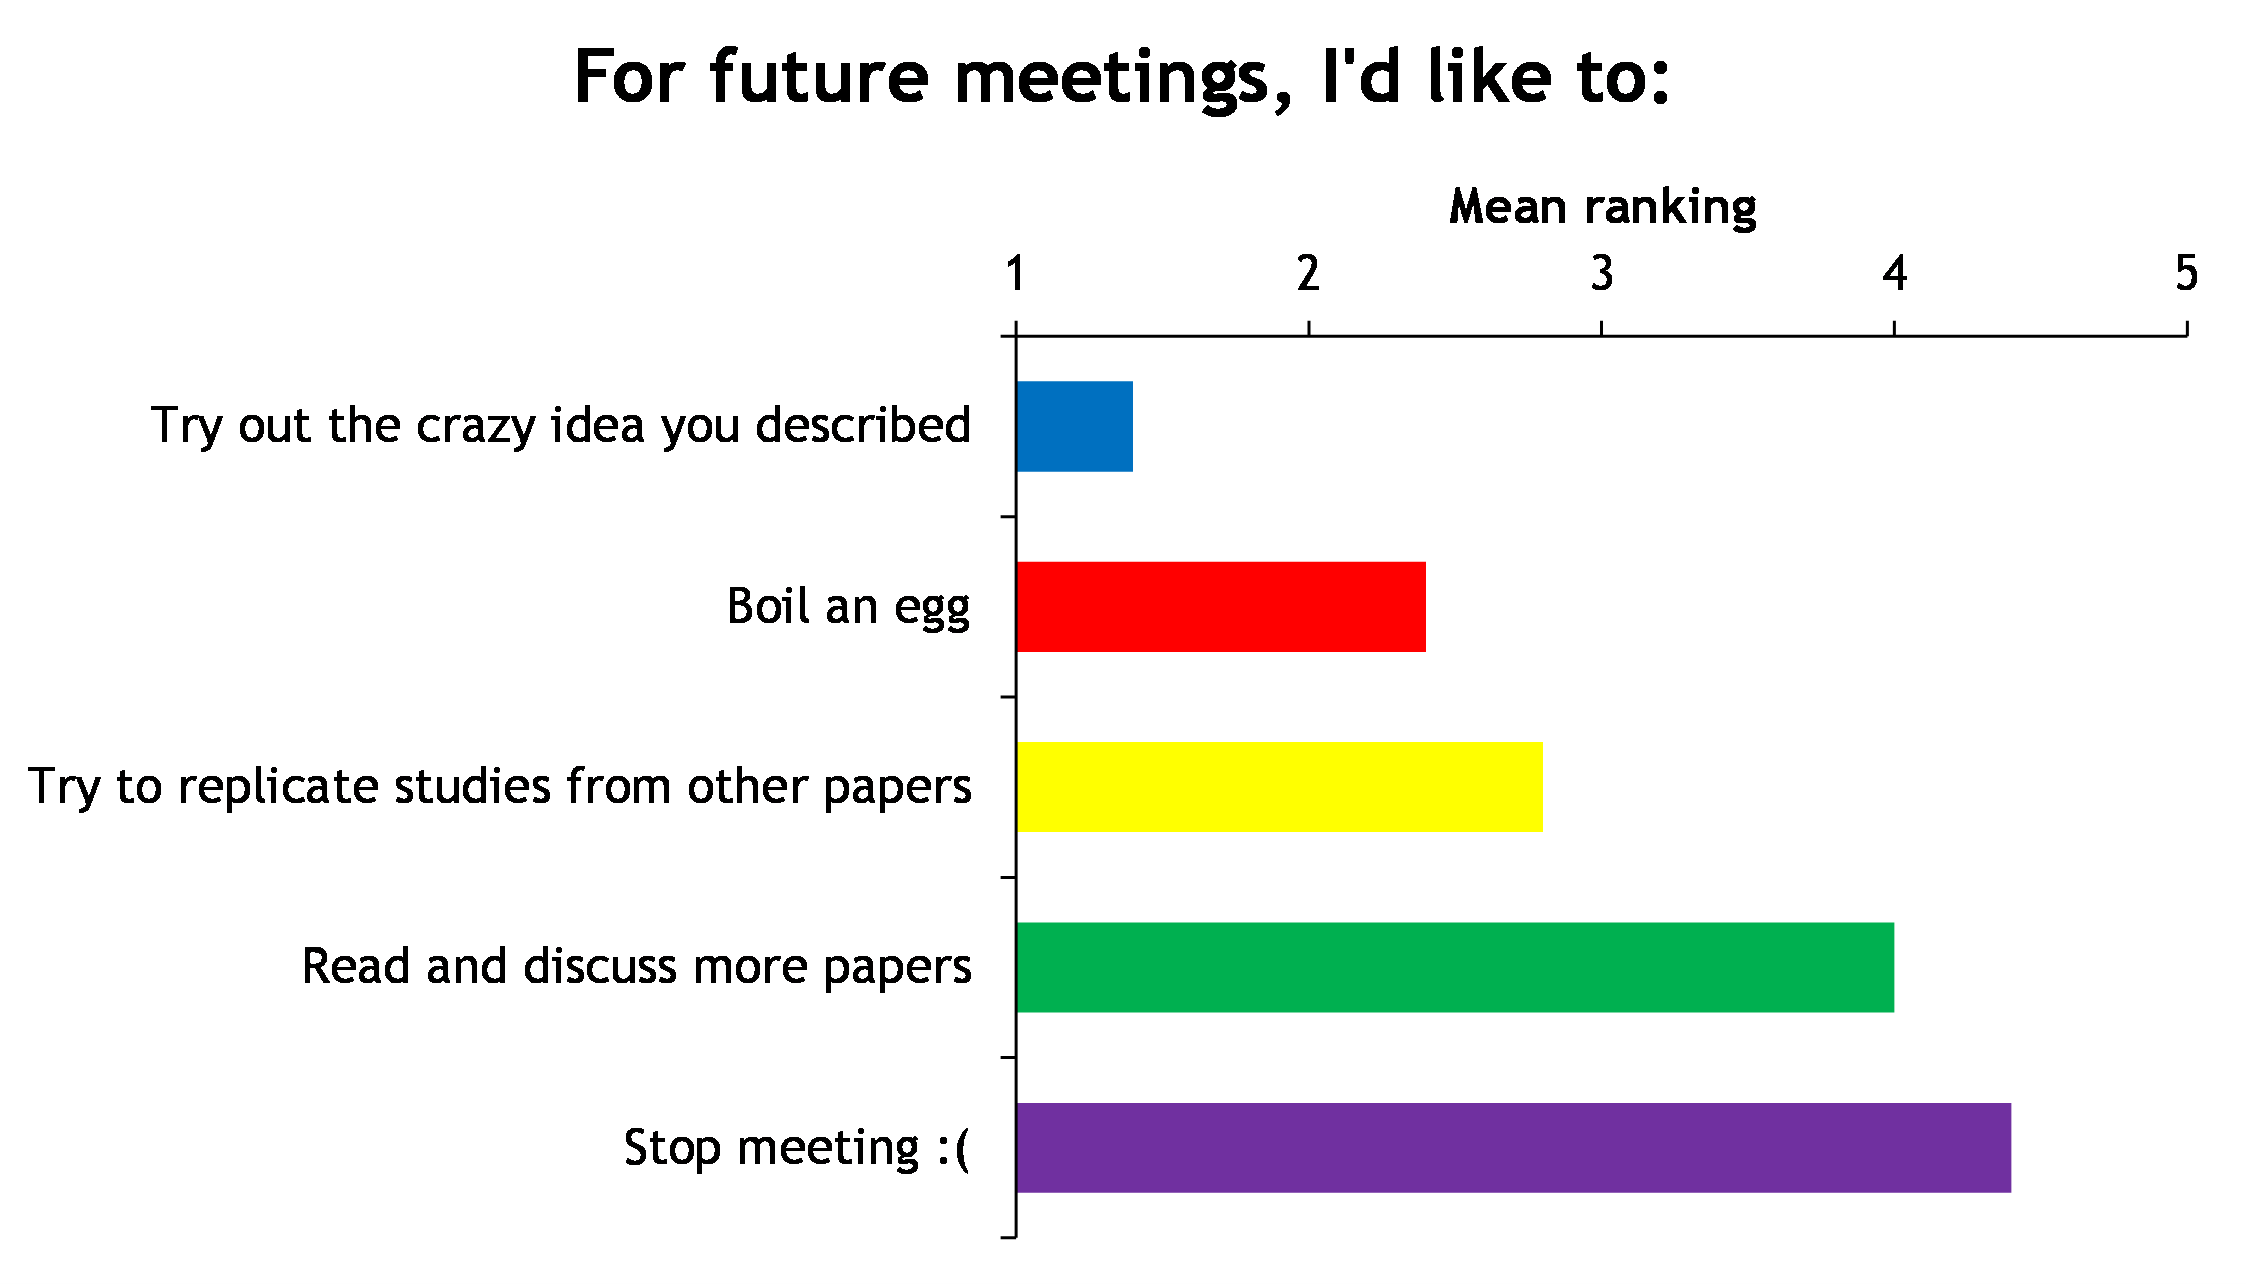
I was leading a team of 6 research assistants, and was trying to figure out the best way to structure my lab meetings. I was worried that my team would filter their feedback in a meeting, and so I ran an anonymized survey asking them what they really thought. For reference, that "crazy" idea involved me showing them how to run random experiments online, some of which are featured on this page:
My research assistants and I also used Mechanical Turk to help us decide what to do for a lab outing:
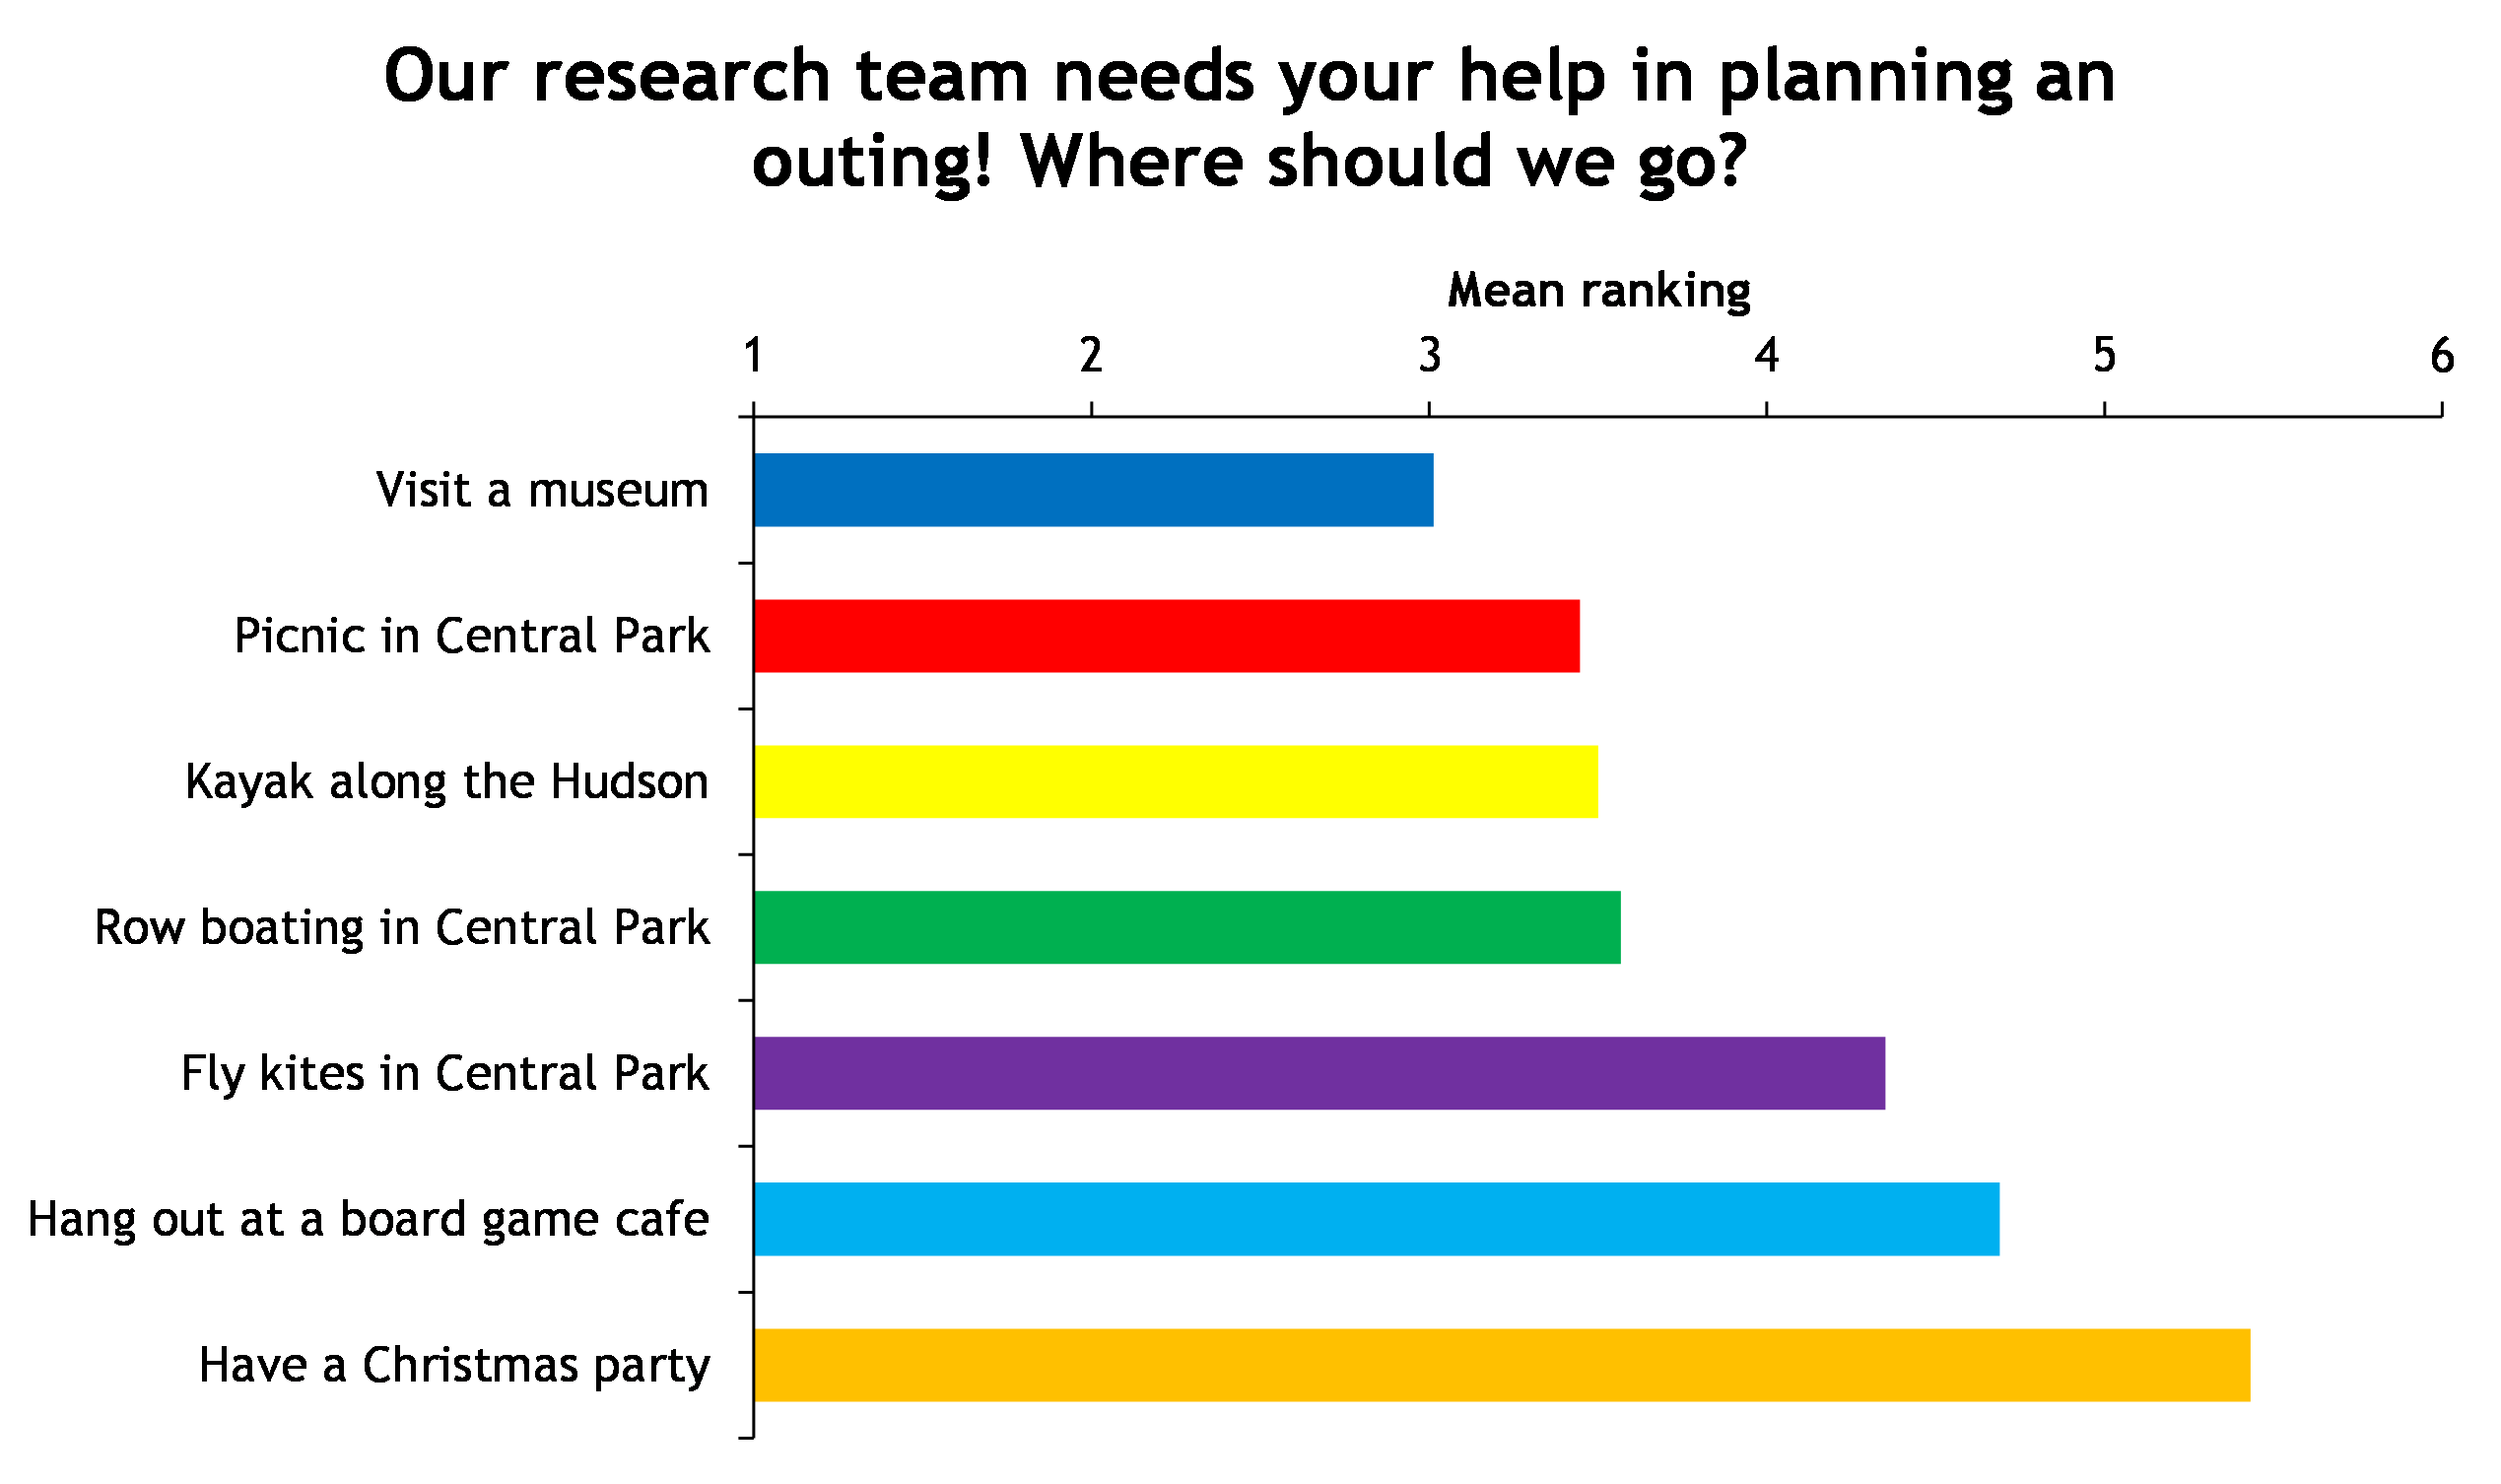
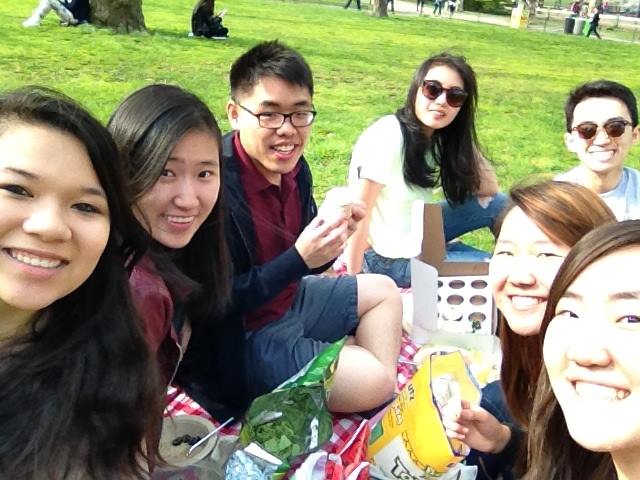
We ended up going with the 2nd option:
Lorem ipsum dolor sit amet, consectetur adipisicing elit. Mollitia neque assumenda ipsam nihil, molestias magnam, recusandae quos quis inventore quisquam velit asperiores, vitae? Reprehenderit soluta, eos quod consequuntur itaque. Nam.
Close ProjectLorem ipsum dolor sit amet, consectetur adipisicing elit. Mollitia neque assumenda ipsam nihil, molestias magnam, recusandae quos quis inventore quisquam velit asperiores, vitae? Reprehenderit soluta, eos quod consequuntur itaque. Nam.
Close ProjectLorem ipsum dolor sit amet, consectetur adipisicing elit. Mollitia neque assumenda ipsam nihil, molestias magnam, recusandae quos quis inventore quisquam velit asperiores, vitae? Reprehenderit soluta, eos quod consequuntur itaque. Nam.
Close ProjectLorem ipsum dolor sit amet, consectetur adipisicing elit. Mollitia neque assumenda ipsam nihil, molestias magnam, recusandae quos quis inventore quisquam velit asperiores, vitae? Reprehenderit soluta, eos quod consequuntur itaque. Nam.
Close Project